chronis is the event-sourced task CLI built on the AllSource embedded database — cn create, cn list, cn claim, every state change an immutable event. It also ships a local web viewer: run cn serve and you get a browser view of the same workspace, served straight from the binary with no Node, no build step, no network.
Until now that viewer was mostly read-only chrome around a task list. 0.8.0 makes it a place you'd actually want to look at your work. Four changes, all live on crates.io today.
cargo install chronis      # binary is `cn`
cn serve                    # http://localhost:7777
The whole UI is HTMX plus a little vanilla JS, styled with a Tokyo Night palette, with every asset vendored locally — it works on a plane.
1. Sortable dashboard columns
Every data column header on the Dashboard is now a sort control. Click cycles ascending → descending; only the active column shows the indicator.
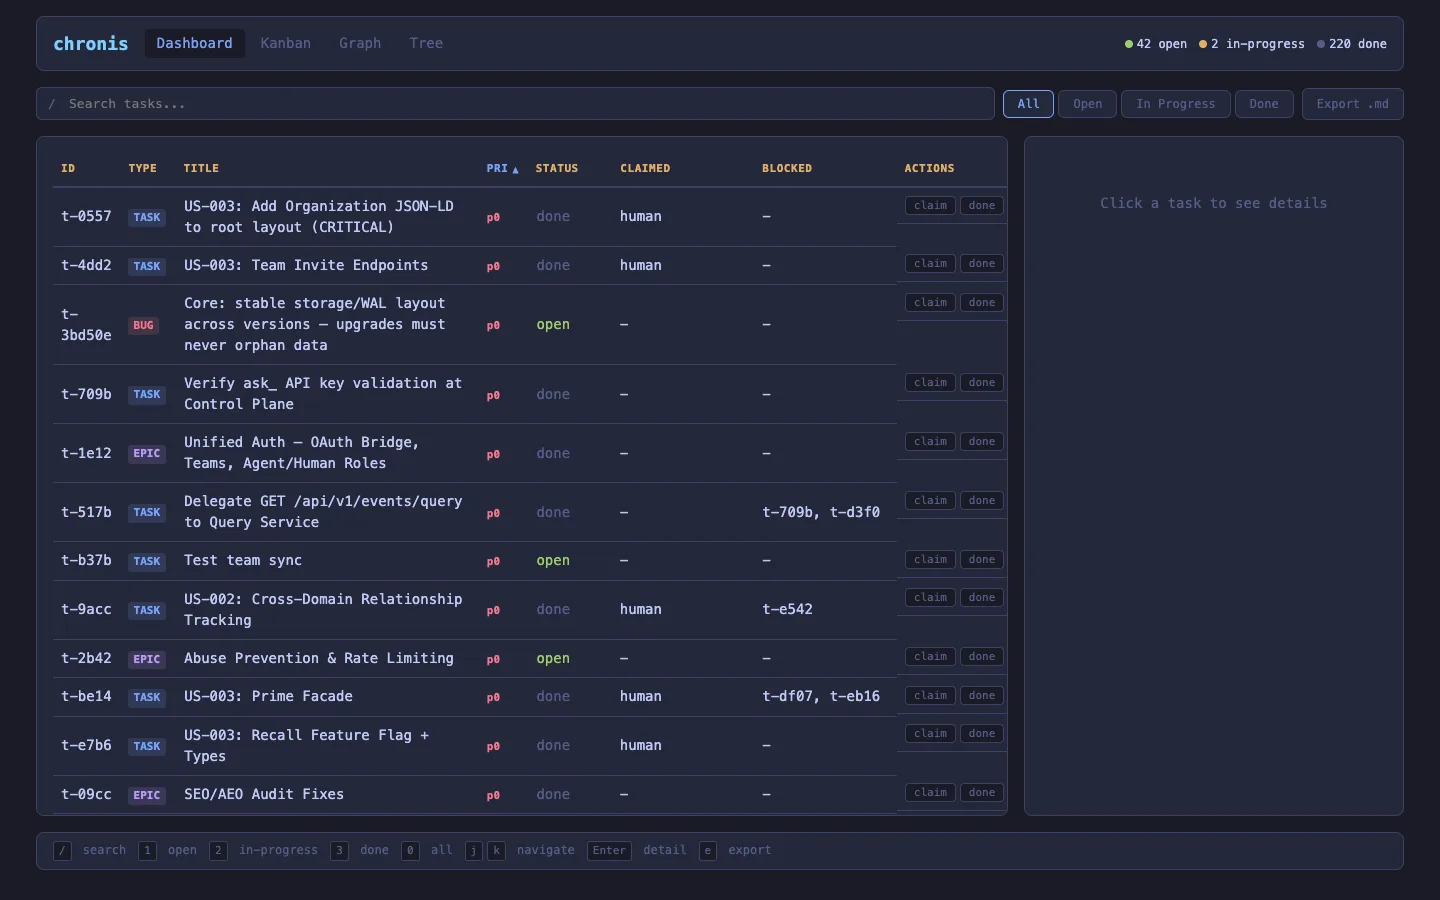
The part that matters is semantic ordering, not lexical. Priority sorts p0 < p1 < p2 < p3. Status sorts by workflow — in-progress, then open, then done — not alphabetically. Type and blocked-state group sensibly. The rows carry data-pri / data-status / data-type / data-blocked attributes so the sort keys are stable instead of scraped from badge text.
Two details make it feel finished:
- It survives the refresh. The task list re-renders every 30 seconds (and on every action) via HTMX. The sort re-applies on
htmx:afterSwap, so a background refresh never snaps you back to default order. - It persists. The active column + direction live in
localStorage, so a reload restores your view. Headers are real<button>s witharia-sort— keyboard and screen-reader operable.
2. An expand-in-place detail pane — with dependencies both ways
Click a task and the detail pane now does two new things.
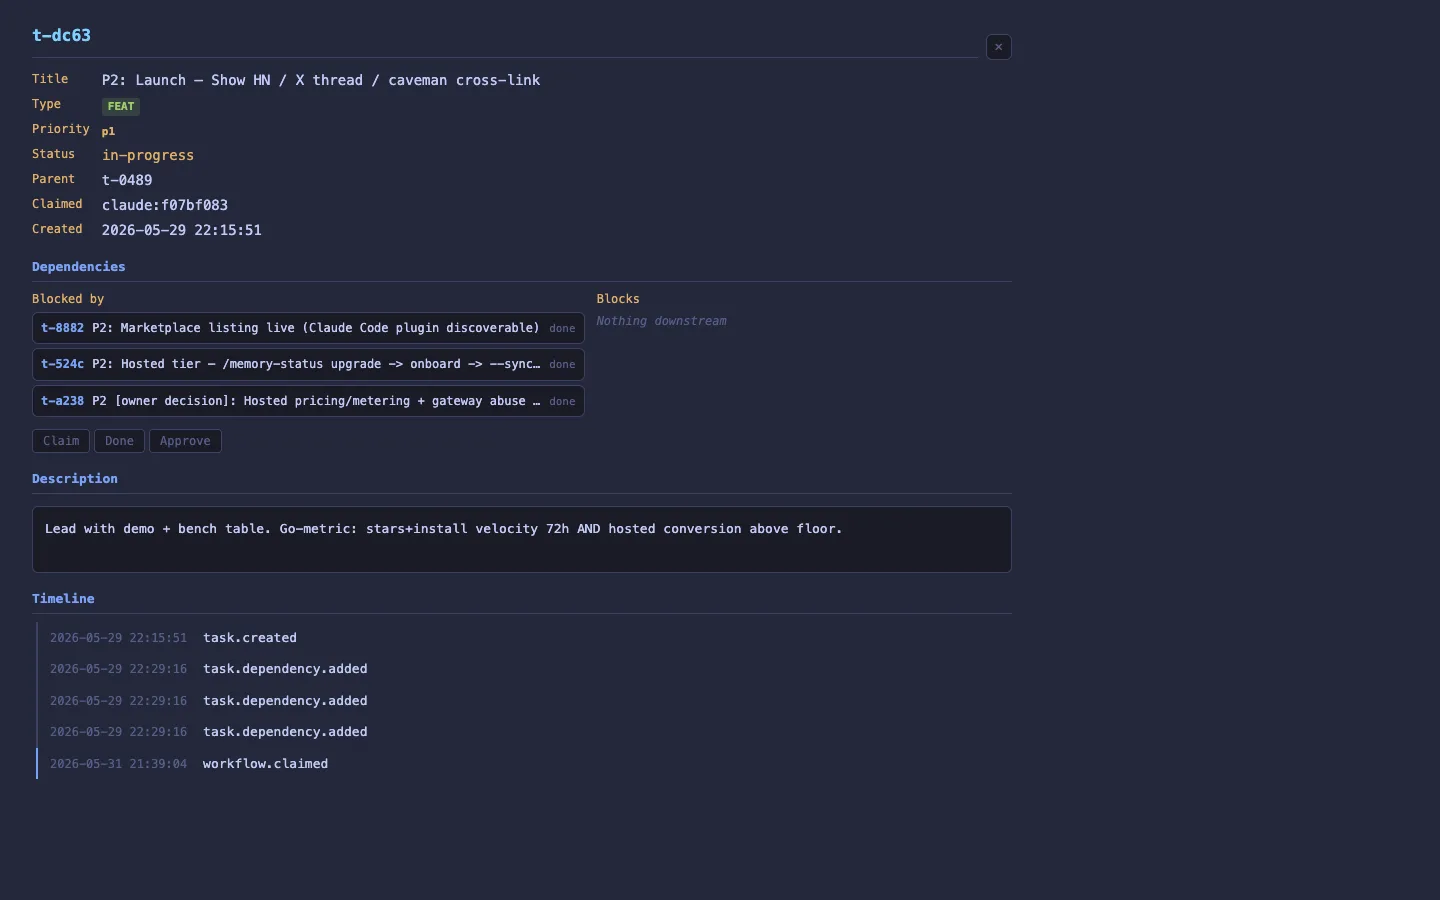
First, it shows dependencies in both directions. The old pane only listed "Blocked by" (what this task waits on). Now there's a Blocks section too — the tasks waiting on this one. The store only keeps the forward blocked_by edge, so the reverse set is gathered by a bounded scan over the workspace; it reproduces exactly the edge set the graph draws. Every entry is clickable, so you can walk a dependency chain by clicking through the pane.
Second, the pane expands in place to fill the viewport — room to read a long description and timeline without a cramped sidebar. Collapse with the control, the ×, or Esc; focus returns where it was. The behaviour is shared across all four views (Dashboard, Kanban, Graph, Tree) from one script, so it works identically everywhere.
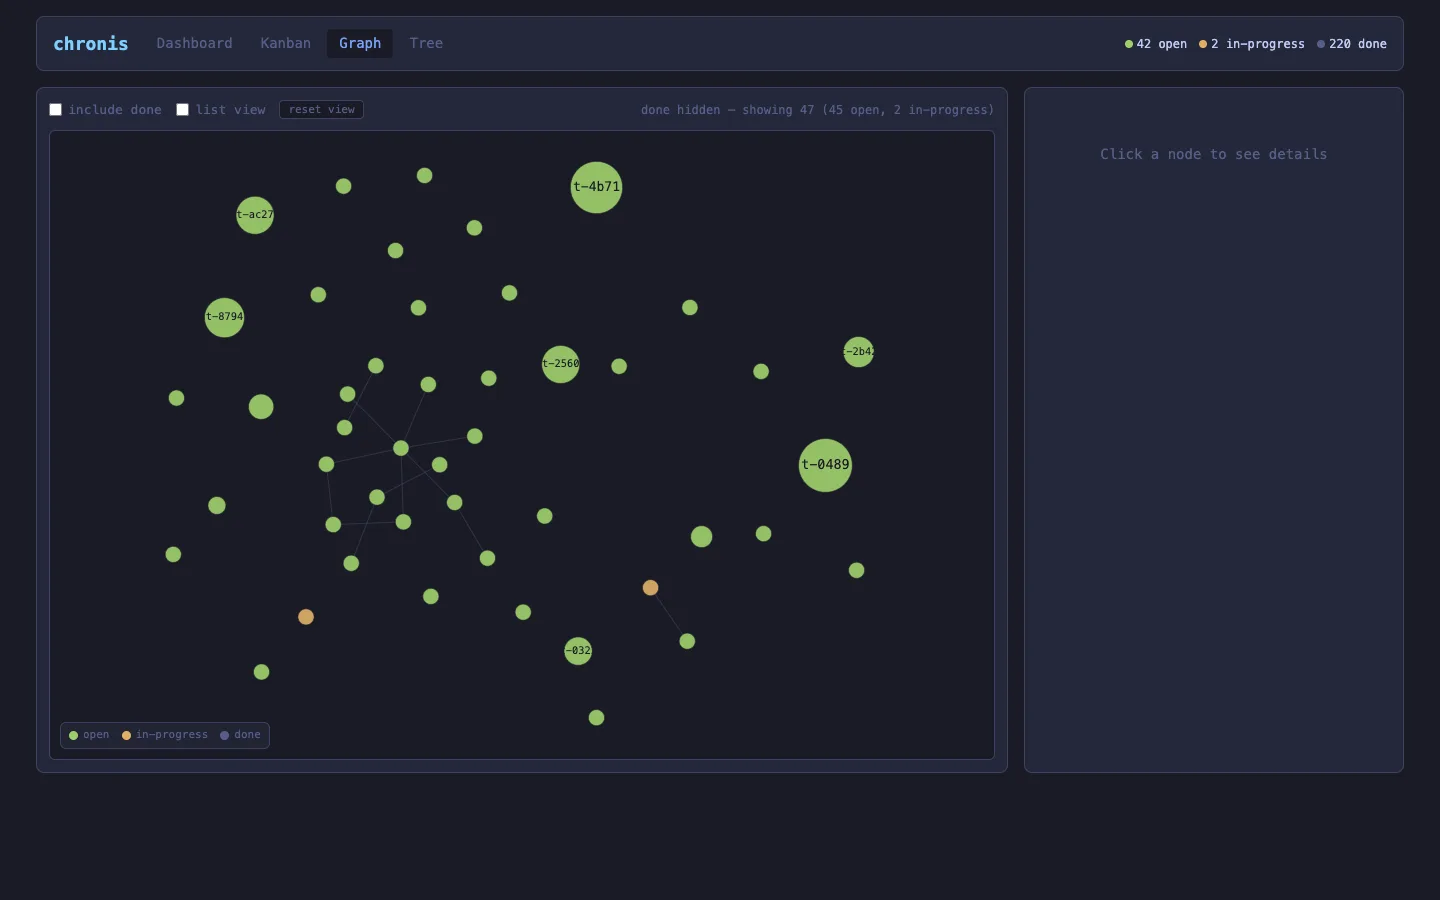
3. A bubble graph for structure at a glance
The Graph tab used to be a long, scrolling text outline. Now it's an interactive force-directed bubble map, in the spirit of bubblemaps.

- Bubble area ∝ subtree size. Epics with lots of descendants are big; leaf tasks are small. The shape of the project falls out of the layout.
- Links are dependency edges (blocker → blocked), so bottleneck chains are visible as connected clusters.
- Colour encodes status. Pan, zoom, and drag bubbles around; hover for a tooltip; click a bubble to load it into the same detail pane from change #2.
It renders to a canvas with a hand-rolled force simulation — zero third-party JavaScript, nothing from a CDN, which keeps the offline-first promise intact even at a few hundred nodes. Done tasks are hidden by default (a workspace can carry hundreds) with a toggle to bring them back, and there's a text-list fallback for keyboard and screen-reader users, since a canvas graph isn't natively accessible.
4. A calmer tree
The Tree view had all the right behaviour — status / priority / type filters, search, expand-collapse, stale-epic filtering, .md export — but it read as a dense wall.
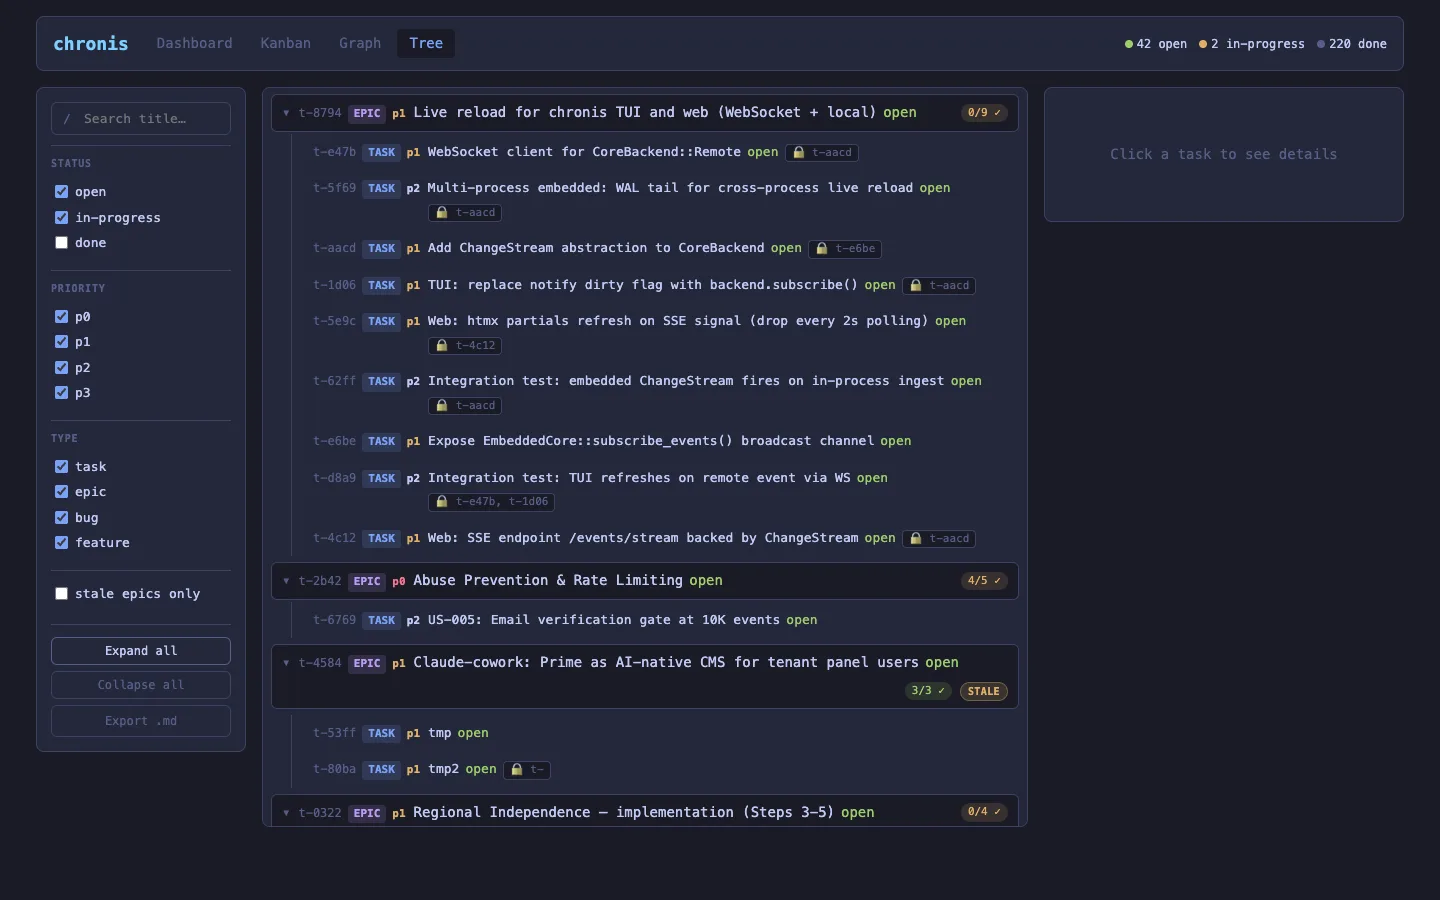
0.8.0 is a presentation pass with zero behaviour change: clearer hierarchy guides, uniform row rhythm, long titles that wrap with a clean hanging indent, epic progress as compact proportion pills, and the loud red "blocked by" labels demoted to a quiet badge. The filter rail is regrouped with section headers and its actions set apart. Every filter, the search, expand/collapse, and export work exactly as before — verified against the full regression checklist.
Try it
cargo install chronis
cd your-project          # a workspace with a .chronis / .beads dir
cn serve --open          # opens the viewer in your browser
No tasks yet? cn create "first task" --type feat and refresh. Everything you see in the viewer is a projection of the event log underneath — the same log the CLI writes to, durable across restarts.
0.8.0 is on crates.io. The viewer is local-first by design; if you want it backed by your hosted tenant Core, point chronis at the gateway with an API key and the same events sync up.