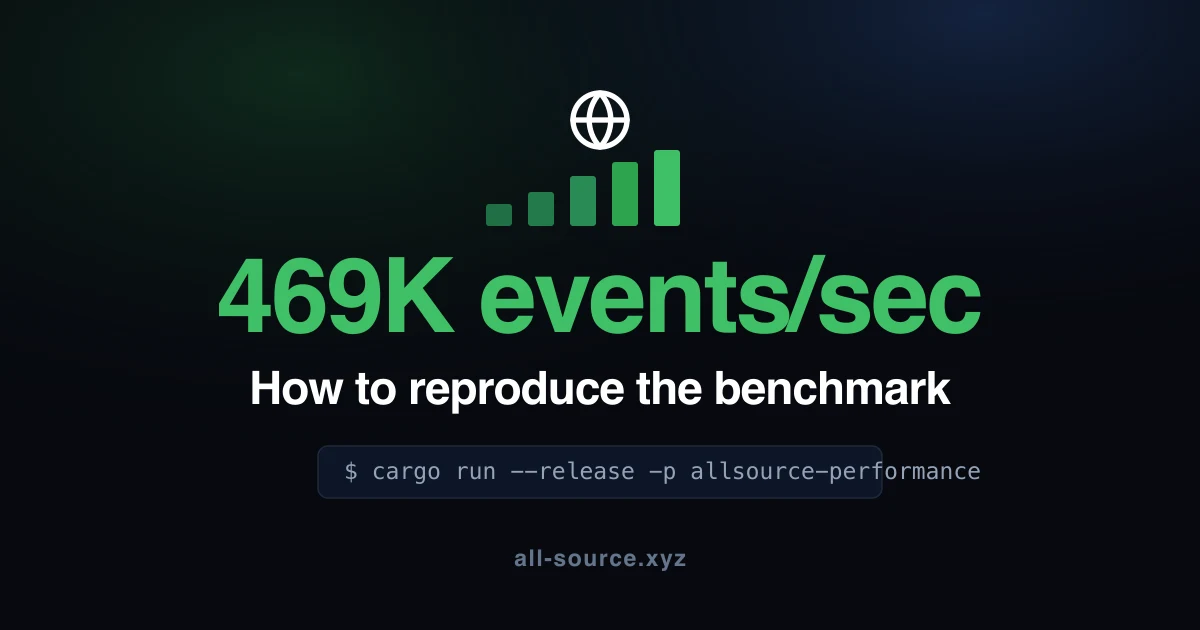
We say AllSource ingests 469K events/sec. You have no reason to take that on faith — benchmark numbers in READMEs are usually cherry-picked, run in debug-with-a-tailwind, or measure something that isn't the thing you care about. So the harness ships in the repo, and this post walks you through running it and reading it honestly.
The one command
You need a Rust toolchain (rustup) and the repo:
git clone https://github.com/all-source-os/all-source
cd all-source
cargo run --release -p allsource-performance
That's it. First run compiles allsource-core in release mode (a couple of minutes); subsequent runs are instant. --release is mandatory — the harness prints a warning if you forget, because debug builds run 10–20× slower and would make us look bad in the wrong direction.
What it actually measures
The harness (tooling/performance/src/main.rs) isolates the hot paths of Core's ingestion pipeline and then runs them together. Each stage asserts a minimum throughput target, so a regression turns into a failed run instead of a silent slowdown.
| Benchmark | What it isolates |
|---|---|
| SIMD JSON parsing | Parsing event payloads — the first thing every ingest does |
| Lock-free queue | Single-producer push/pop with no mutex |
| Sharded queue | The same under 4 concurrent producers |
| Batch processor | The end-to-end ingestion path: parse → queue → batch. This is the 469K number. |
| Arena pool | Allocation reuse on the hot path (no per-event malloc) |
| SIMD filtering | Predicate evaluation over a batch of events |
| Full pipeline | Concurrent batch ingestion across threads |
| Sustained | Throughput held over a 2-second wall-clock window |
The headline figure is the batch processor: the realistic ingestion path, not a micro-benchmark of one primitive.
Reading the output
Each stage prints its rate and a PASS/WARN against its target. The lines that matter:
=== Batch Processor Performance ===
Events/sec: 494151
PASS: 494151 > 200000

=== Full Pipeline Performance (Concurrent) ===
Events/sec: 948341
PASS: 948341 > 300000

=== Sustained Throughput Test ===
Events/sec: 380536
PASS: 380536 > 200000
That run is an Apple M2 Max (12 cores). The batch path measured 494K events/sec — the 469K we quote is, if anything, conservative on this machine. A 4-thread pipeline pushes ~948K, and sustained throughput over two seconds holds ~380K. Run it on a Linux server with more cores and you'll likely see higher; run it on a laptop on battery and you'll see less. That variance is the point — it's your number now.
The honest caveats
A benchmark you can't poke holes in is marketing. Here's what this one does and doesn't claim:
- It measures the in-memory ingestion pipeline. Durability — the WAL
fsyncand Parquet flush — is intentionally off this hot path: events are checksummed into the WAL and the WAL is fsync'd on a configurable interval (default 100 ms), so ingestion latency isn't gated on disk. That's a deliberate design choice, not a way to inflate the number. If you want to measure end-to-end durable throughput including sync-per-event, that's a different (lower) number and a different config. - It's synthetic event data. Real payloads vary; parsing cost scales with size. The harness uses a representative nested JSON document (~137 bytes), so your mileage varies with your schema.
- SIMD availability is detected at runtime. On the M2 Max run above, the SIMD filter falls back to a scalar path and still does 9.1M events/sec — the numbers don't depend on hand-tuned intrinsics being present.
Why this matters more than the number
The throughput is nice, but the reason it's in the repo as a runnable target is trust. If you're evaluating an event store you'll eventually put your company's facts into, "trust me, it's fast" is not a sentence you should accept. Clone it, run it, read the source, and disagree with us in an issue if the methodology is wrong. That's a better contract than a slide.
- Run it:
cargo run --release -p allsource-performance - Read the harness:
tooling/performance/src/main.rs - The design behind the numbers: Building an AI-native event store in Rust